
Deliver targeted, efficient advising with Backrs Analytics
“This is incredible!” - Educators, when they see our insights suite for the first time. Find out why.
By Courtney Kelly
Our newly released Analytics Dashboard provides educators unprecedented insight into the students they serve.
Find out what students' school, work, and life aspirations really are, uncover the progress they're making towards their goals, dig into their life-readiness, and more.
Together, this data empowers educators like you to deliver the right interventions at the right time, no more guesswork. Check it out:
What do your students hope for their futures?
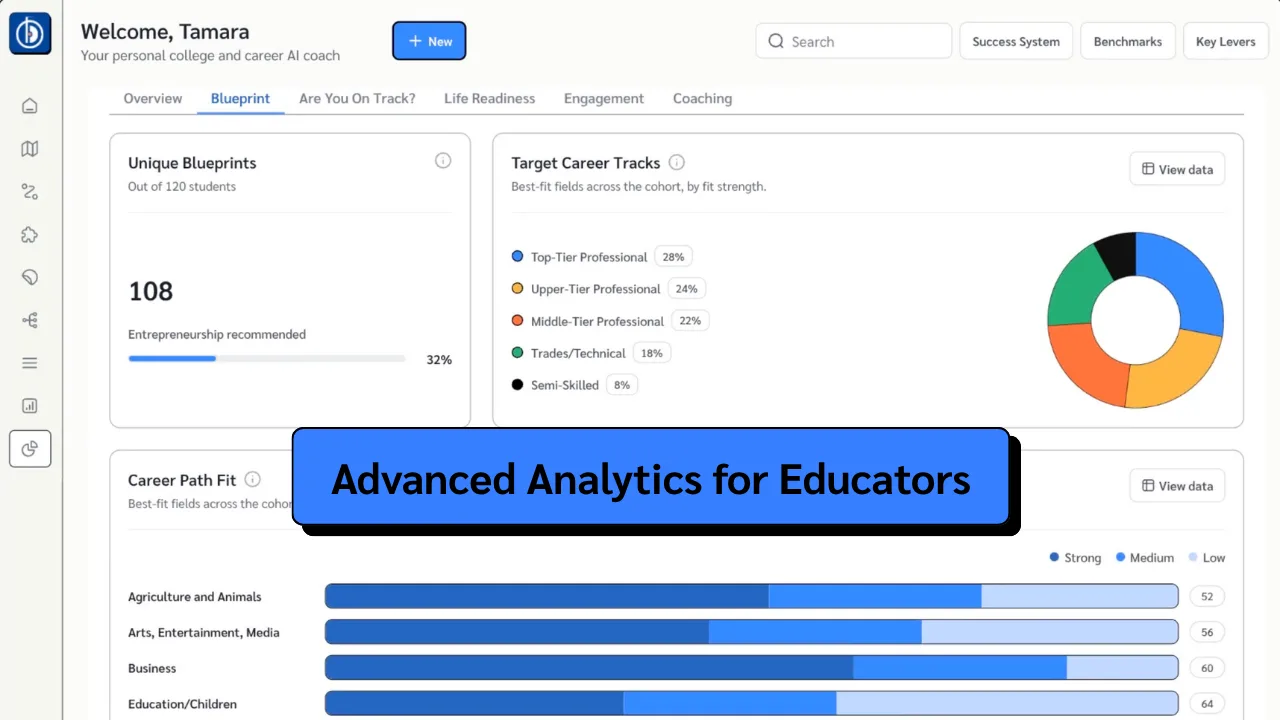
Review your Blueprint data to get in-depth reports on:
- Blueprint completion
- Students' target career tracks
- Strong, medium, and low career path fits
- Postsecondary education plans
- Sources of meaning
- Lifestyle, family, and other personal aspirations
- Professional aspirations
Drill down into each aggregate report for insights on individual students so you can use turn this data into effecient, personalized advising.
See how we share Blueprint data via our Platform Sandbox.
Explore Blueprint Data in Our Sandbox
See who's on and off track, intervene early
Once you know students' aspirations, you need to know whether they're on track to achieve them. That's why we're delivering detailed breakdowns of students' Are You on Track assessment data across all four unlocks directly to your analytics dashboard.
As with Blueprint data, you can drill down into the individual students behind the aggregate reports, enabling you to prioritize outreach and deploy interventions as soon as they're needed.
Check out Are You on Track reports in our Platform Sandbox.
Explore Are You on Track Reports
Dig deeper with Lubav
As with everything on our platform, your Analytics Suite comes with built-in access to Lubav, our AI coach, so you can dig deeper into all your reports.
Wondering how to interpret a metric? Curious about how data across multiple categories intersect? Want to know more about the students behind the reports?
Take Lubav for a spin in our Platform Sandbox.